| at: |
US National Whitewater Center |
Data from Positive Flow
 show on map
 animate
Trail users:


Elevation Profile
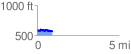
 0.945395 mi
 137.31 ft
 165.46 ft
 -28.15 ft
 3.31 %
GPX Downloads: Track Route
![]()
| at: |
US National Whitewater Center |
show on map
animate
0.945395 mi
137.31 ft
165.46 ft
-28.15 ft
3.31 %